0
0
0
0
#datavis
Latest posts tagged with #datavis on Bluesky
Posts tagged #datavis


Busan South Korea Map

Busan South Korea Map
Celebrate your home with a #ModernMap of #Busan #SouthKorea #Asia. Get your own custom map today iandaprints.com. #datavis #datavisualization #custommap #dataart #Mapart #minimalism #inkandatlas #iandaprints
0
0
0
0

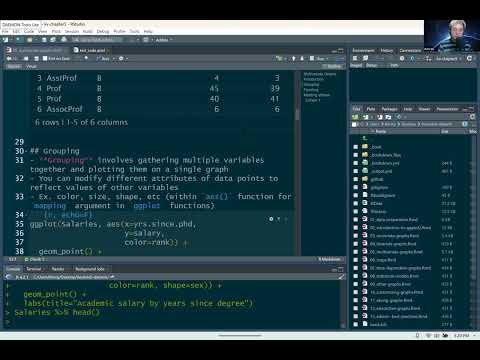
From the DSLC.video aRchives:
🔵 Data Visualization with R: Multivariate Graphs youtu.be/Wz0WCFv-gOk
🔵 Advanced R: Quasiquotation youtu.be/IXE21pR8EJ0
Support the Data Science Learning Community at patreon.com/DSLC
#dataBS #dataVisualization #datavis #dataviz #RStats
0
0
1
0


‘Epic’ cyclone Narelle spreads damage and disrupts mines and gas -
Fantastic #datavis with this piece showing the dust
giftarticle.ft.com/giftarticle/... via @FT
4
2
0
0

‘Epic’ cyclone Narelle spreads damage and disrupts mines and gas -
Fantastic #datavis with this piece showing the dust
giftarticle.ft.com/giftarticle/actions/rede... via @FT
0
4
0
0
One of my favourite #datavis authors. I prefer a better integration of visualization and statistics, and he's probably the best example.
6
0
0
0

Theodore Roosevelt National Park Map

Theodore Roosevelt National Park Map
Celebrate your trip and deck out your office with a custom #TheodoreRoosevelt #NationalPark map. Get your own custom map today iandaprints.com. #datavis #datavisualization #custommap #dataart #Mapart #Wallart #minimalism #inkandatlas #iandaprints
0
0
0
0


I started creating a vega-lite builder to help me teach people how to create visuals in Deneb. I think there are some pretty nice features in it, so feel free to take a look and see if it could be useful to you, too.
#PowerBI #Datavis #VegaLite #Deneb
powerbiferrytales.github.io/vegalite.html
7
2
1
0


For today's #30DayChartChallenge, I used the {marimekko} package 📦.
Day 0️⃣3️⃣ | Comparisons | Mosaic
Code available here: github.com/KittJonathan...
#RStats #tidyverse #code #datavis
5
2
0
0

Well designed dashboard too
#datavis #datascience #climate
7
0
0
0

A line graph titled "Number of reported hate crimes in Portugal" showing a timeline from 1990 to 2025. The graph features an orange line that remains relatively flat near zero until approximately 2015, followed by a sharp and steady increase. Four specific points on the line are marked with black dots and annotated with the number of far-right Members of Parliament (MPs) at those times: 1 MP in 2019 (at approximately 80 crimes), 12 MPs in 2022 (at approximately 270 crimes), 50 MPs in 2024 (at approximately 420 crimes), and 60 MPs in 2025 (at approximately 450 crimes). The y-axis scales from 0 to 600.
Correlation doesn't imply causation. #datavis
9
1
2
2
#datascience #datavis
Quite a chart treat
4
1
0
0

Here's a starter pack in case you'd like to follow all of the beautiful nerds responsible for the nifty #charts 📊, #maps 🗺️ and fun interactive #DataVis tools (+ occasional games/quizzes) published by the ONS... And also some #30DayChartChallenge entries this month! go.bsky.app/Cq2r7z6
27
7
1
2

Second day of the 2026 #30DayChartChallenge, tried the {ggpop} package.
Day 0️⃣2️⃣ | Comparisons | Pictogram
Code available here : github.com/KittJonathan...
#RStats #tidyverse #code #datavis
7
2
0
0

College Campus Map

College Campus Map
Celebrate your alumnus or student with a #CampusMap of your #CollegeCampus Get your own custom map today iandaprints.com. #datavis #datavisualization #custommap #dataart #Mapart #college #graduate #Alumnus #minimalism #inkandatlas #iandaprints
0
0
0
0


This is a column chart. It is a time series of 1997 to 2025. The vertical axis shows the median house price in England for that year. Each year has a bar, which is broken into smaller rectangles, each representing the median earnings for that year. We can see that in 1997, the median house price was 3.5 times median earnings. However, in 2025, the median house price costs 7.6 times median earnings.
I might have had some silly ideas while working on the vis for this release www.ons.gov.uk/peoplepopula.... I am happy to have an excuse to do something with it now! Not sure I've made it easier to understand the affordability ratio, but FUN.
#30DayChartChallenge #dataviz #datavis #graphs #charts
36
5
1
1


Yes, it's that time of the year when birds sing, flowers flourish, love is in the air and, most importantly, the best bad example of #datavis in a report gets a new update. It's an official report, so you can assume very little changes. But they found SmartArt in PowerPoint. Highlights 1/2
15
5
4
0
1
0
0
0

My entry for day 1 of #30DayChartChallenge: Reported crimes by category. Kidding. It's from the Portuguese Internal Security Report 2025, just published. Always a #datavis delight.
10
2
0
0

The 2026 #30DayChartChallenge kicks off today!
For this year's challenge, I'll use the Palmer Penguins dataset as often as possible.
Day 0️⃣1️⃣ | Comparisons | Part-to-whole
Code available here : github.com/KittJonathan...
#RStats #tidyverse #code #datavis
13
2
0
0


Check out the Statistics Globe Hub: statisticsglobe.com/hub
The Statistics Globe Hub is an ongoing learning program that helps you stay up to date with statistics, data science, AI, and programming using R and Python.
#ggstatsplot #datavis #statistics #datascience #rstats #statisticsglobehub
0
0
0
0

Capetown South Africa Map

Capetown South Africa Map
Celebrate your home with a #ModernMap of #Captown #SouthAfrica #Africa. Get your own custom map today iandaprints.com. #datavis #datavisualization #custommap #dataart #Mapart #minimalism #inkandatlas #iandaprints
0
0
0
0

2
0
2
0

Shenandoah National Park Map

Shenandoah National Park Map
Celebrate your trip and deck out your office with a custom #Shenandoah #NationalPark map. Get your own custom map today iandaprints.com. #datavis #datavisualization #custommap #dataart #Mapart #Wallart #minimalism #inkandatlas #iandaprints
1
0
0
0


ggdiceplot 1.2.0 is now on CRAN. It fixes the 1.1.0 bug where no pips were rendered.
Lesson learned: we need better visual testing. Any recommendations for checking, in an automated way, that plots not only compile but also render as expected in R?
github.com/maflot/ggdic...
#CRAN #Datavis #testthat
0
0
0
0


Screenshot of Augment Code Map, showing the Svelte Compiler Pipeline cluster.

Screenshot of Augment Code Map. Showing the Parser Test Suite cluster.
2
0
0
0
#datavis #datsscience
Ed Hawkins (interview with him below ) is famous for developing the climate strips datavis, showing the long term temperature change at a location, as a colour stripe
www.reading.ac.uk/planet/clima...
3
1
0
0


Finally, my nee bouquets #rstats package was on my ToDo list for 4 years. It lets you visualize time series with bidirectional encoding leading to these often beautiful looking bouquets.
Check out the Github page: github.com/MxNl/bouquets
or the Vignette: mxnl.github.io/bouquets/
#rtistry #datavis
1
0
0
0